Peer Regions Transit Report puts spotlight on region’s transportation efficiency

Sep 18, 2024
| Posted in
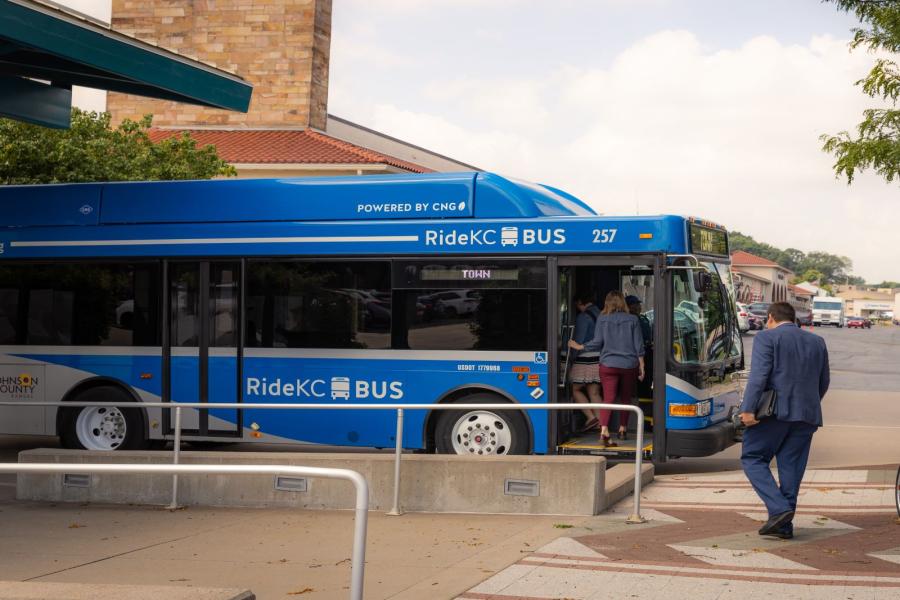
Riders board RideKC bus

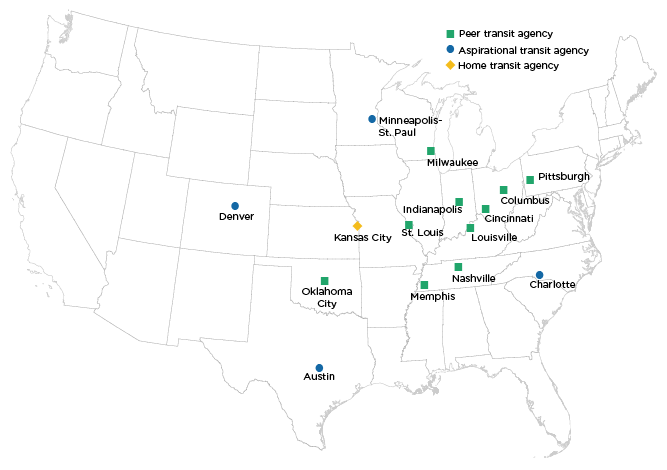
The latest Peer Regions Transit Report, last updated and published in 2018, delves into the pandemic's impact on transit operations, comparing Kansas City's performance with 14 peer and aspirational regions across the United States. This extensive analysis draws from the National Transit Database (NTD), American Community Survey (ACS), surveys of peer transit agencies, local government budget information, and transit agency websites.

Peer Regions Transit Report map
The regions analyzed in the report

Funding Insights

In 2022, Kansas City transit agencies allocated $46.53 per person in operating funds from state and local sources, placing 12th out of 15 urbanized areas (UZAs). Funding per capita varies widely by jurisdiction with the highest in Kansas City, Missouri, and significantly lower in suburban jurisdictions. Funding increases have been observed from state sources since this data was collected. In contrast, Minneapolis, Pittsburgh, and Milwaukee UZAs receive substantial state funding, while Columbus, Denver, and Austin rely heavily on fares and directly generated revenue, such as regional or county-wide funding models.

In 2021, Kansas City's UZA spent $1.39 million in state operating funding, ranking 10th among 15 peer and aspirational UZAs. This figure represents a significant drop from $2.6 million in 2016 and falls below the median of $8.7 million for peer cities. Aspirational cities, on average, received a substantial $148 million. 

Ridership Trends

The Kansas City Area Transportation Authority (KCATA) stands out as the only primary agency offering a fare-free system as of 2023. Other agencies provide limited free routes or modes, such as streetcars. Despite limited funding, KCATA ranks as the fifth most-used transit system among 11 peer primary agencies and eighth among all 15 agencies. Ridership has decreased by 25.7% since the previous report in 2018, a decline less severe than the median decrease of 45.4% among all peer and aspirational primary agencies. This resilience suggests that KCATA may be better positioned to withstand the nationwide trend of declining ridership in recent years. Ridership increases have been observed since the data was collected for the report. 

Moreover, the Kansas City UZA has the second-lowest cost per rider, highlighting the system's economic efficiency in managing its expenses. 

This report underscores the challenges and achievements of Kansas City's transit system, offering a detailed comparison with other regions and providing valuable insights for future improvement.