New dashboards added to Housing Data Hub shine a light on housing problems in the Kansas City region

Aug 14, 2023
| Posted in
lacks-complete-plumbing

These pages cover:

  • Housing problems provides an overview of all HUD-defined housing problems.
  • Overcrowding explores the issue of more than one inhabitant per room in a housing unit.
  • Cost burden shows data on households spending more than 30% of their income on housing.

They draw on the Comprehensive Housing Affordability Strategy (CHAS) data. CHAS data consists of custom tabulations of American Community Survey (ACS) data from the U.S. Census Bureau provided to the U.S. Department of Housing and Urban Development (HUD). This data demonstrates the extent of housing problems and housing needs, particularly for low-income households. The pages on the Housing Data Hub feature the most recent version of this data from 2015 – 2019.

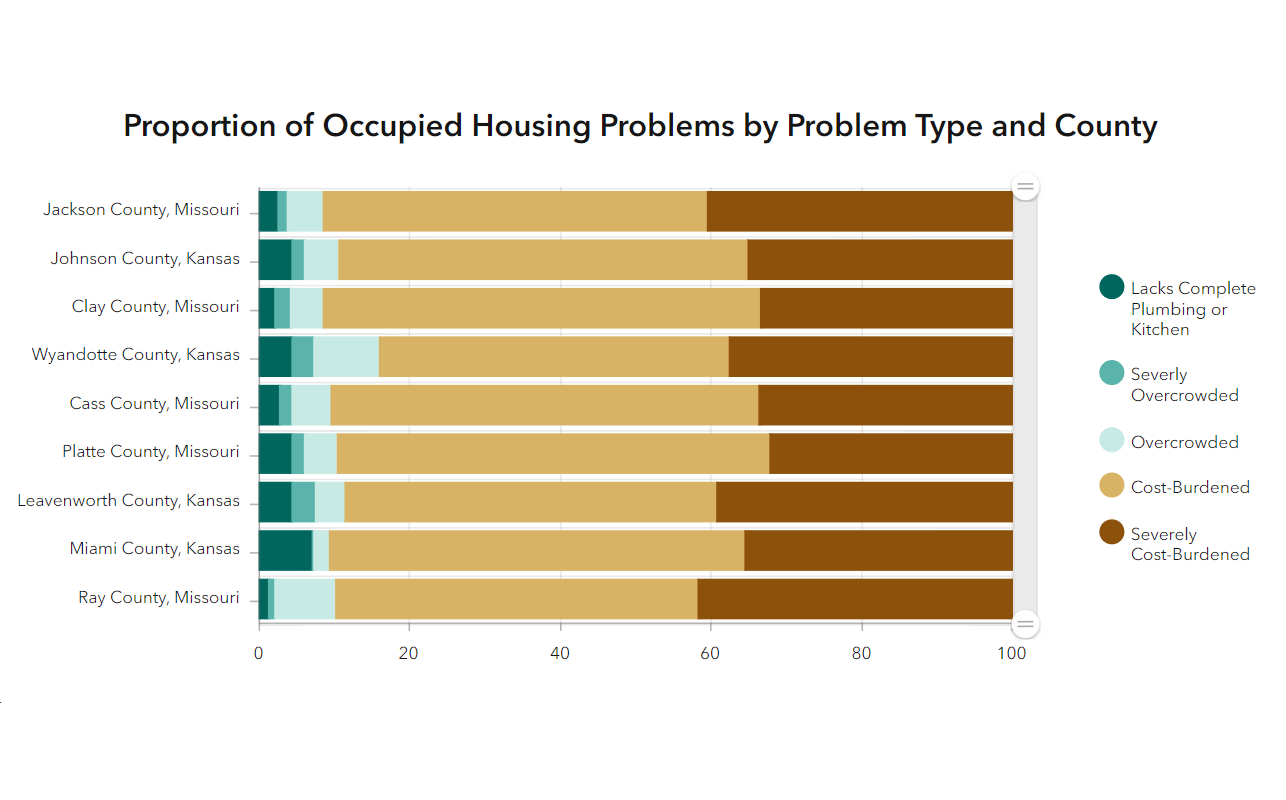
CHAS categorizes five types of housing problems: Lacks complete plumbing or kitchen; overcrowding; severe overcrowding; cost burden; and severe cost burden. Of these challenges, cost burden and severe cost burden are the most common across every county in the region, as can be seen in the brown and tan areas of the chart below. This data may be found on Housing Data Hub on the Housing Problems page in the Supply section:

proportion-of-occupied-housing-problems-by-problem-type-and-county

Users can further examine the issue of cost burden on the Cost Burden page. Here one can view cost burden across income groups, resident tenure and family types. Using the county-level geography dashboard, we can see cost burden affects low-income renters more than any other group. In the region, 90% of cost-burdened households are low-income. Renters account for 35% percent of all households in the region yet makeup more than 55% of regional households experiencing cost burden. 

share-of-cost-burdened-households-by-tensure

The new Overcrowding page allows users to examine overcrowding across the same groupings. We see similar patterns to those in costburden where 65% of overcrowded households in the region are low-income, and over 65% of the area’s overcrowding is experienced by renters.

share-of-overcrowded-housing-units-by-occupant-tensure

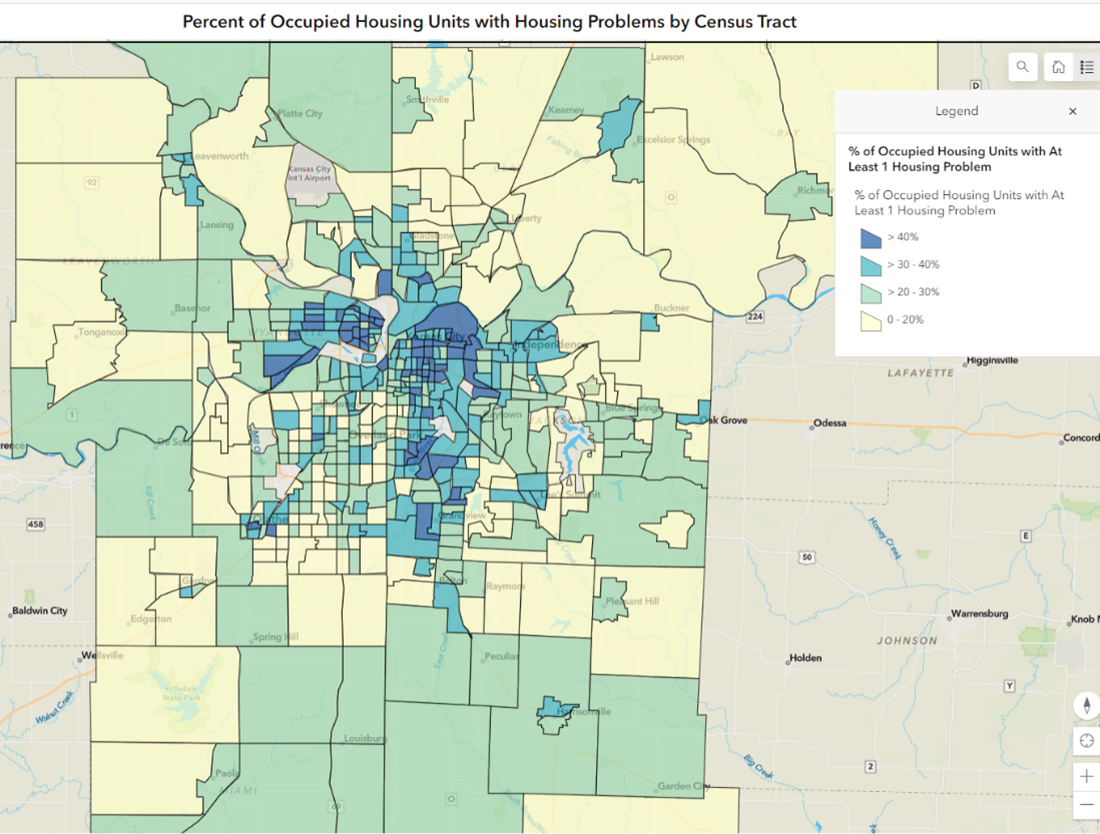
Users can choose a variety of geographies at which to explore the data, with tract, city and county-level summary options. Users can zoom to their particular area(s) of interest and compare across the region. At the tract level, the map element is useful in identifying areas with high concentrations of housing problems as defined in CHAS. The map below shows areas in Kansas City, Kansas, and Kansas City, Missouri, in blue, indicating over 40% of households with one or more housing problems within that census tract.

percent-of-occupied-housing-units-by-housing-problems-by-census-tract

This type of information may be useful to community members to better understand the challenges their neighbors face, to non-profits when looking to target initiatives or apply for grant funding, or to municipalities and planners in problem definition and strategic planning.

We want to hear from you! Tell us how you will use these new pages.