The history of racial discrimination in housing is an essential part of understanding the housing challenges facing our communities today.
In the Kansas City region, Black residents have one-third the housing wealth of white households1, lower rates of homeownership2 and lower home values3. People of color still largely reside in parts of the region where poverty is also concentrated. This disparate housing reality is not by accident, but rather lies in the region’s history of discriminatory practices embedded in policies that greatly affected how housing markets operate. Even after the policies changed in the 1960s, they created a set of self-perpetuating forces that still generate disparate racial outcomes today. Because these outcomes are the result of incentives created by how housing markets are structured, rather than simply the acts or intentions of individuals, they occur as the result of structural racism4. This blog explores the enduring impact of historic discriminatory real estate practices in the Kansas City housing market.
Housing segregation between races in the Kansas City region began as a private practice.
As Black Americans increasingly migrated to Kansas City after the Civil War, many communities implemented racially restrictive covenants to ensure housing segregation5. Deeds included legally enforceable, contractual agreements which prohibited the sale, occupancy or leasing of homes and apartments to certain racial groups, especially Black Americans6. In Kansas City, J.C. Nichols was one of the first developers to use deed restrictions and other tools, such as declarations of restrictions in official records, high price points and homes associations, to exclude people of color from accessing his company’s developments7.
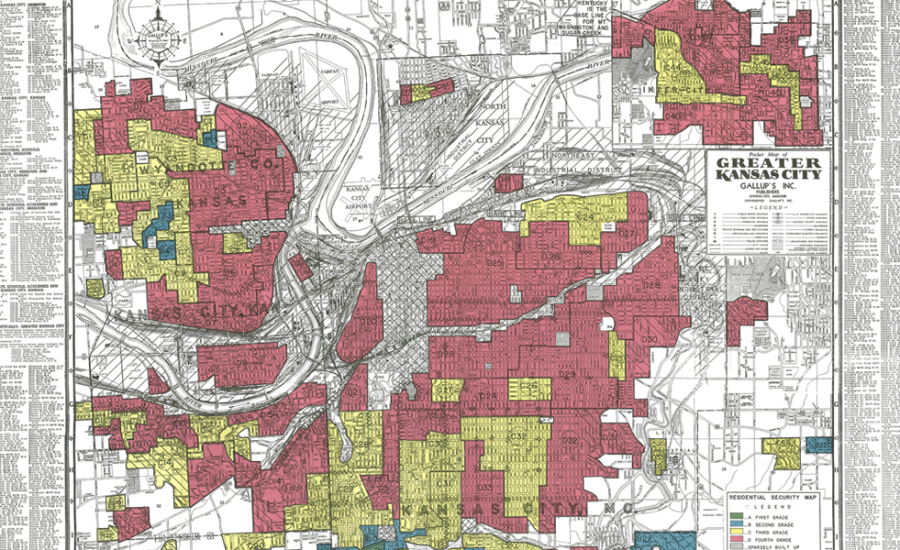
By the late 1930’s, the Home Owners’ Loan Corporation (HOLC) created color-coded residential security maps of major American cities that classified neighborhoods by perceived level of lending risk8. The neighborhood ranking system, also known as “redlining,” assigned areas with minority residents a rating of “Hazardous” (at an elevated level of perceived lending risk) and colored the areas red. The practice denied mortgage applications in areas assigned “Hazardous” and “Declining” ratings on the basis they were too risky for lending institutions to provide credit.
What began as private practice became federal policy and further engrained into real estate practices.
In 1934, the federal government created the Federal Housing Administration (FHA) as part of the New Deal. The FHA insured banks, mortgages and other lenders, thereby encouraging the construction of new homes and the repair of existing structures. As the FHA implemented these programs, developers successfully lobbied the federal government to adopt the HOLC risk ratings into the national lending standards. As a result, FHA programs benefited almost entirely white people9. Future federal benefits programs, such as the GI Bill and Department of Veterans Affairs loans built off the discriminatory FHA protocol and further perpetuated unequal outcomes for housing.
Other real estate practices, such as racial steering and subprime lending, also made purchasing a home in Black neighborhoods less attractive and more costly. The impact of these policies and practices remains evident in our housing markets today.
The impacts from the institutionalization of HOLC maps are still evident today.
The Fair Housing Act of 196810 banned HOLC maps, but the impacts from decades of unfair real estate practices persist today. In Kansas City, we continue to see significant differences between geographies in the residential security maps historically rated as C (Declining) and D (Hazardous) neighborhoods which the Black population was limited to living in and areas historically labeled A (Best) and B (Desirable) which were only accessible to the white population. More than 50 years after the Fair Housing Act, 2020 Census data demonstrates that lower-rated HOLC neighborhoods still have lower home values, lower rates of homeownership and higher rates of minority residents.
Persistent Housing Value Gaps
The map below demonstrates similar geographic patterns in the current day housing market when compared to HOLC redlining maps. Swipe right to see the historic HOLC boundaries and swipe left to see rates of homeownership, median home value, concentrations of poverty and racial characteristics of the same area. Select one comparison variable at a time using the eye icon. Check out this animated gif for more information on how to use the map.