Housing production in the Kansas City region has not recovered from the Great Recession that began in 2007 and ended in 2009. For 15 years, the region has been underbuilding. According to new research by the Mid-America Regional Council (MARC), this produced an actual housing gap of 12,000 to 24,000 units. Underbuilding plays a significant role in the rapid increase in housing prices and rents in the region. A lack of supply impacts families across the region whether they are looking for their dream home or just trying to find an affordable place to rent.
In prior research, MARC found a mismatch between rents and renter income. Nearly 64,000 households in the region are unable to find affordable rents at current rates. Underbuilding exacerbates the affordability gap as there are not enough housing units in the region to meet household demand.
Current housing production levels cannot close the underbuilding gap. The region has averaged 6,700 units of new housing (single-family and multifamily combined) per year since 2008. An underbuilding gap of 12,000 units would require an additional 1,000 units per year over the next five years at a minimum. At the high end, closing a gap of 24,000 units would require building 10,000 units each year for the next decade. In either scenario, this pace of construction does not account for population growth.
Underbuilding a Long-Term Issue
Housing production in the United States is cyclical, rising and falling with broader economic trends, but production did not recover from two major events in the last twenty years. First was the Great Recession. Housing production declined dramatically in the aftermath. In the Kansas City region, the annual production of single- and multifamily housing is about 58% pre-crisis levels. Recovery was further complicated by the pandemic. Housing production declined in 2023 as single- and multifamily permits in the region fell to their lowest levels in over a decade.
The issue is not unique to this region. According to a 2023 report by the Congressional Research Service, economists and housing trade groups estimate the national underbuilding gap to be anywhere from 1.6 to 3.8 million units. Underbuilding is estimated by comparing how many housing units exist with how many ought to exist based on historical trends. Measuring something that does not currently exist means studies of underbuilding produce a wide range of missing units. Researchers identify the gap by utilizing historical trends to understand how conditions have changed over time and how underbuilding impacts both supply and demand in the housing market.
The historical data accounts for a few important factors. One is the ideal vacancy rate. These are houses under renovation or being prepared for sale. All housing markets have vacancies and the ideal rate is one in which these units are in the process of coming to market to meet demand. Household formation, or how many new households are formed, is another key factor. Examples of this would be an individual or couple renting their own place instead of living with their parents or with roommates. Another would be a new family buying their first home. By examining historical data, researchers can understand the rates at which households form, as well as the ideal level of vacancy, and then compare those rates to the actual number of housing units, households and vacancies that exist today.
The Method and Findings
MARC’s analysis of the underbuilding gap accounts for the annual change in households and unit production while subtracting second homes and properties without plumbing or kitchen facilities. The methods utilized in this analysis are found here. These methods were adapted from work by Up for Growth, a nonprofit organization looking at housing production across the country. MARC chose Up for Growth’s method for its clear methodology and replicable findings.
Estimating underproduction relies on the two key factors outlined above. The first, household formation, is often limited by housing cost. Lack of production has a compound effect on household formation as prices rise. Regarding vacancy rates, as units being prepared for sale decline it creates upward pressures on prices. Our analysis utilized Up for Growth’s national vacancy rate of 5%. The region’s current vacancy rate is around 8% and historically between 10 to 12%. At the higher vacancy rate, the underbuilding gap is about 24,000 units.
Housing Production Pre- and Post-2008 Financial Crisis
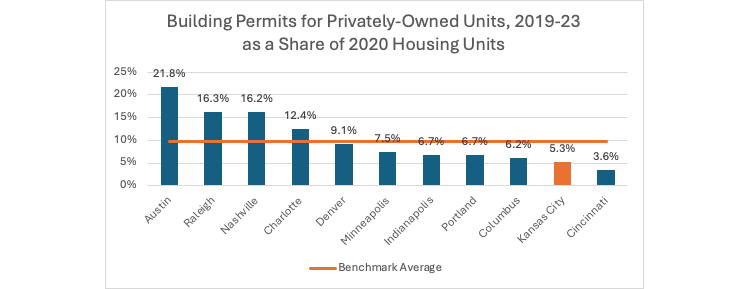
Housing production in the Kansas City region ranked tenth out of 11 peer metros over the past five years. Robust housing production was a key component of building the quality of life and affordability the region relied on to attract economic development and growth. Production declines following the Great Recession and post-Covid places that affordability in jeopardy. The decline in new housing supply and falling vacancy rates result in higher home prices and increasing rents. This combined with minimal wage growth impacts the quality of life of many households in the region.
Since 2008, the average number of single-family building permits has been about half of the average production in the two decades prior. In the same period, multifamily construction is about three-quarters the average prior to 2008.
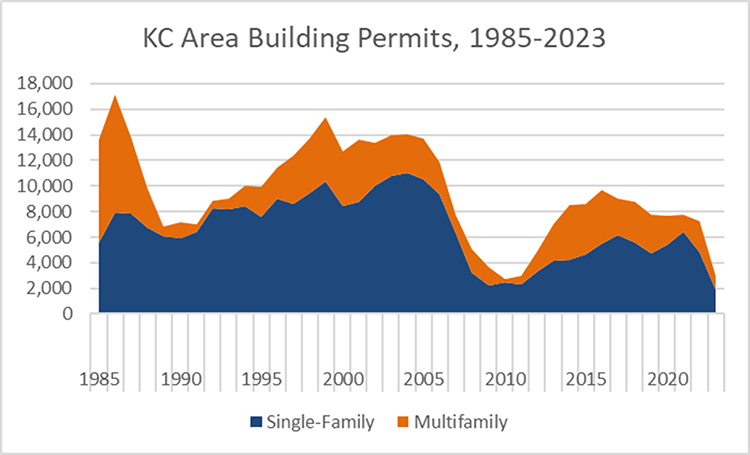
Data Source: Source: Greater Kansas City Homebuilders Association
MARC tracks the economic activity of ten peer metros to benchmark the region’s performance. Between 2019 and 2023, the Kansas City region ranked second to last in housing production, both in total units and when accounting for a percentage increase in annual units built.
Data Sources: U.S. Census Bureau Building Permits Survey, 2020 Decennial Census
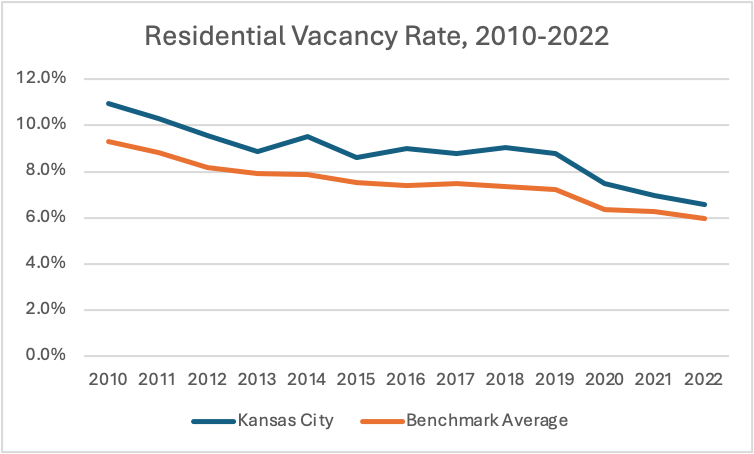
Permits only provide the supply side of the housing market. Another question might be to what degree is supply keeping up with demand? A simple way to look at this is to examine what is happening to vacancy rates. If supply is not keeping up, then vacancy rates should drop. That is what is happening in Kansas City and its peer metros. Residential vacancy rates have been dropping for over a decade.
Data Source: U.S. Census Bureau American Community Survey, 1-year data
