Focus Area Dropdown Menu
Aging
Early Learning
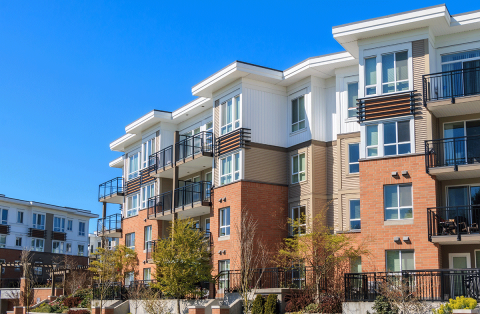
Economy & Housing
Environment
Health
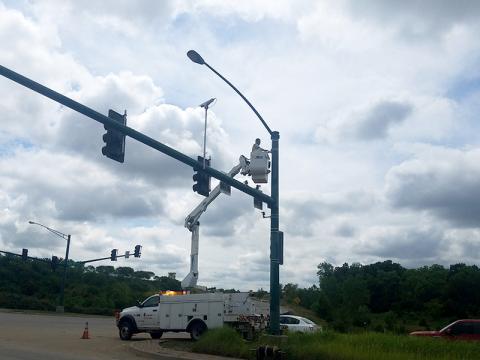
Local Government
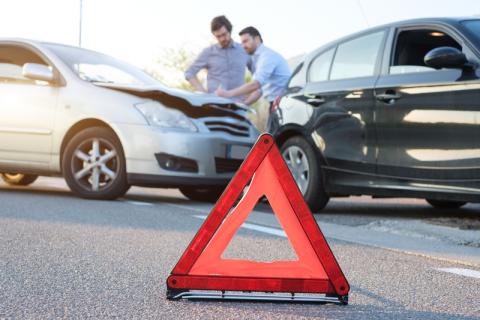
Safety & Security
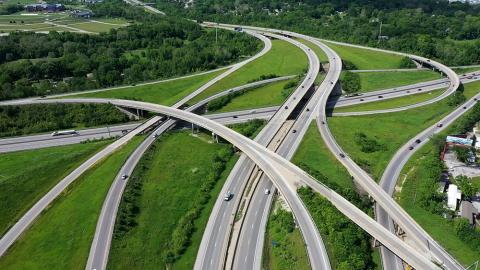
Transportation

Economy & Housing

Building a competitive regional economy with plentiful housing
Go to Economy & Housing
Health

Improving health outcomes through nutrition and mental and physical health supports
Go to HealthLocal Government
Helping cities and counties work more efficiently and effectively
Go to Local GovernmentSafety & Security

Coordinating effective emergency services and a reliable 911 system across boundaries
Go to Safety & Security